
Power BI Widget: KPI and Business Intelligence on Digital Workplace
A great new feature of Synigo Pulse is to share Business Intelligence KPI's with your colleagues using the brand new Power BI widget. Let us show you how to do this. Below we give some examples how the endresult could be.
In the first screenshot you see a diagram of a personal KPI about profitability. The second shows the KPI of a HRM Department, the number of active employees. The next one represents the actual sales of units per business line. The fourth screenshot is an example how the digital workplace looks like on the mobile phone. This little pie diagram gives you the distribution of sessions per type of browser of a website. Interestingly, we have Google Analytics data connected with Microsoft PowerBi.
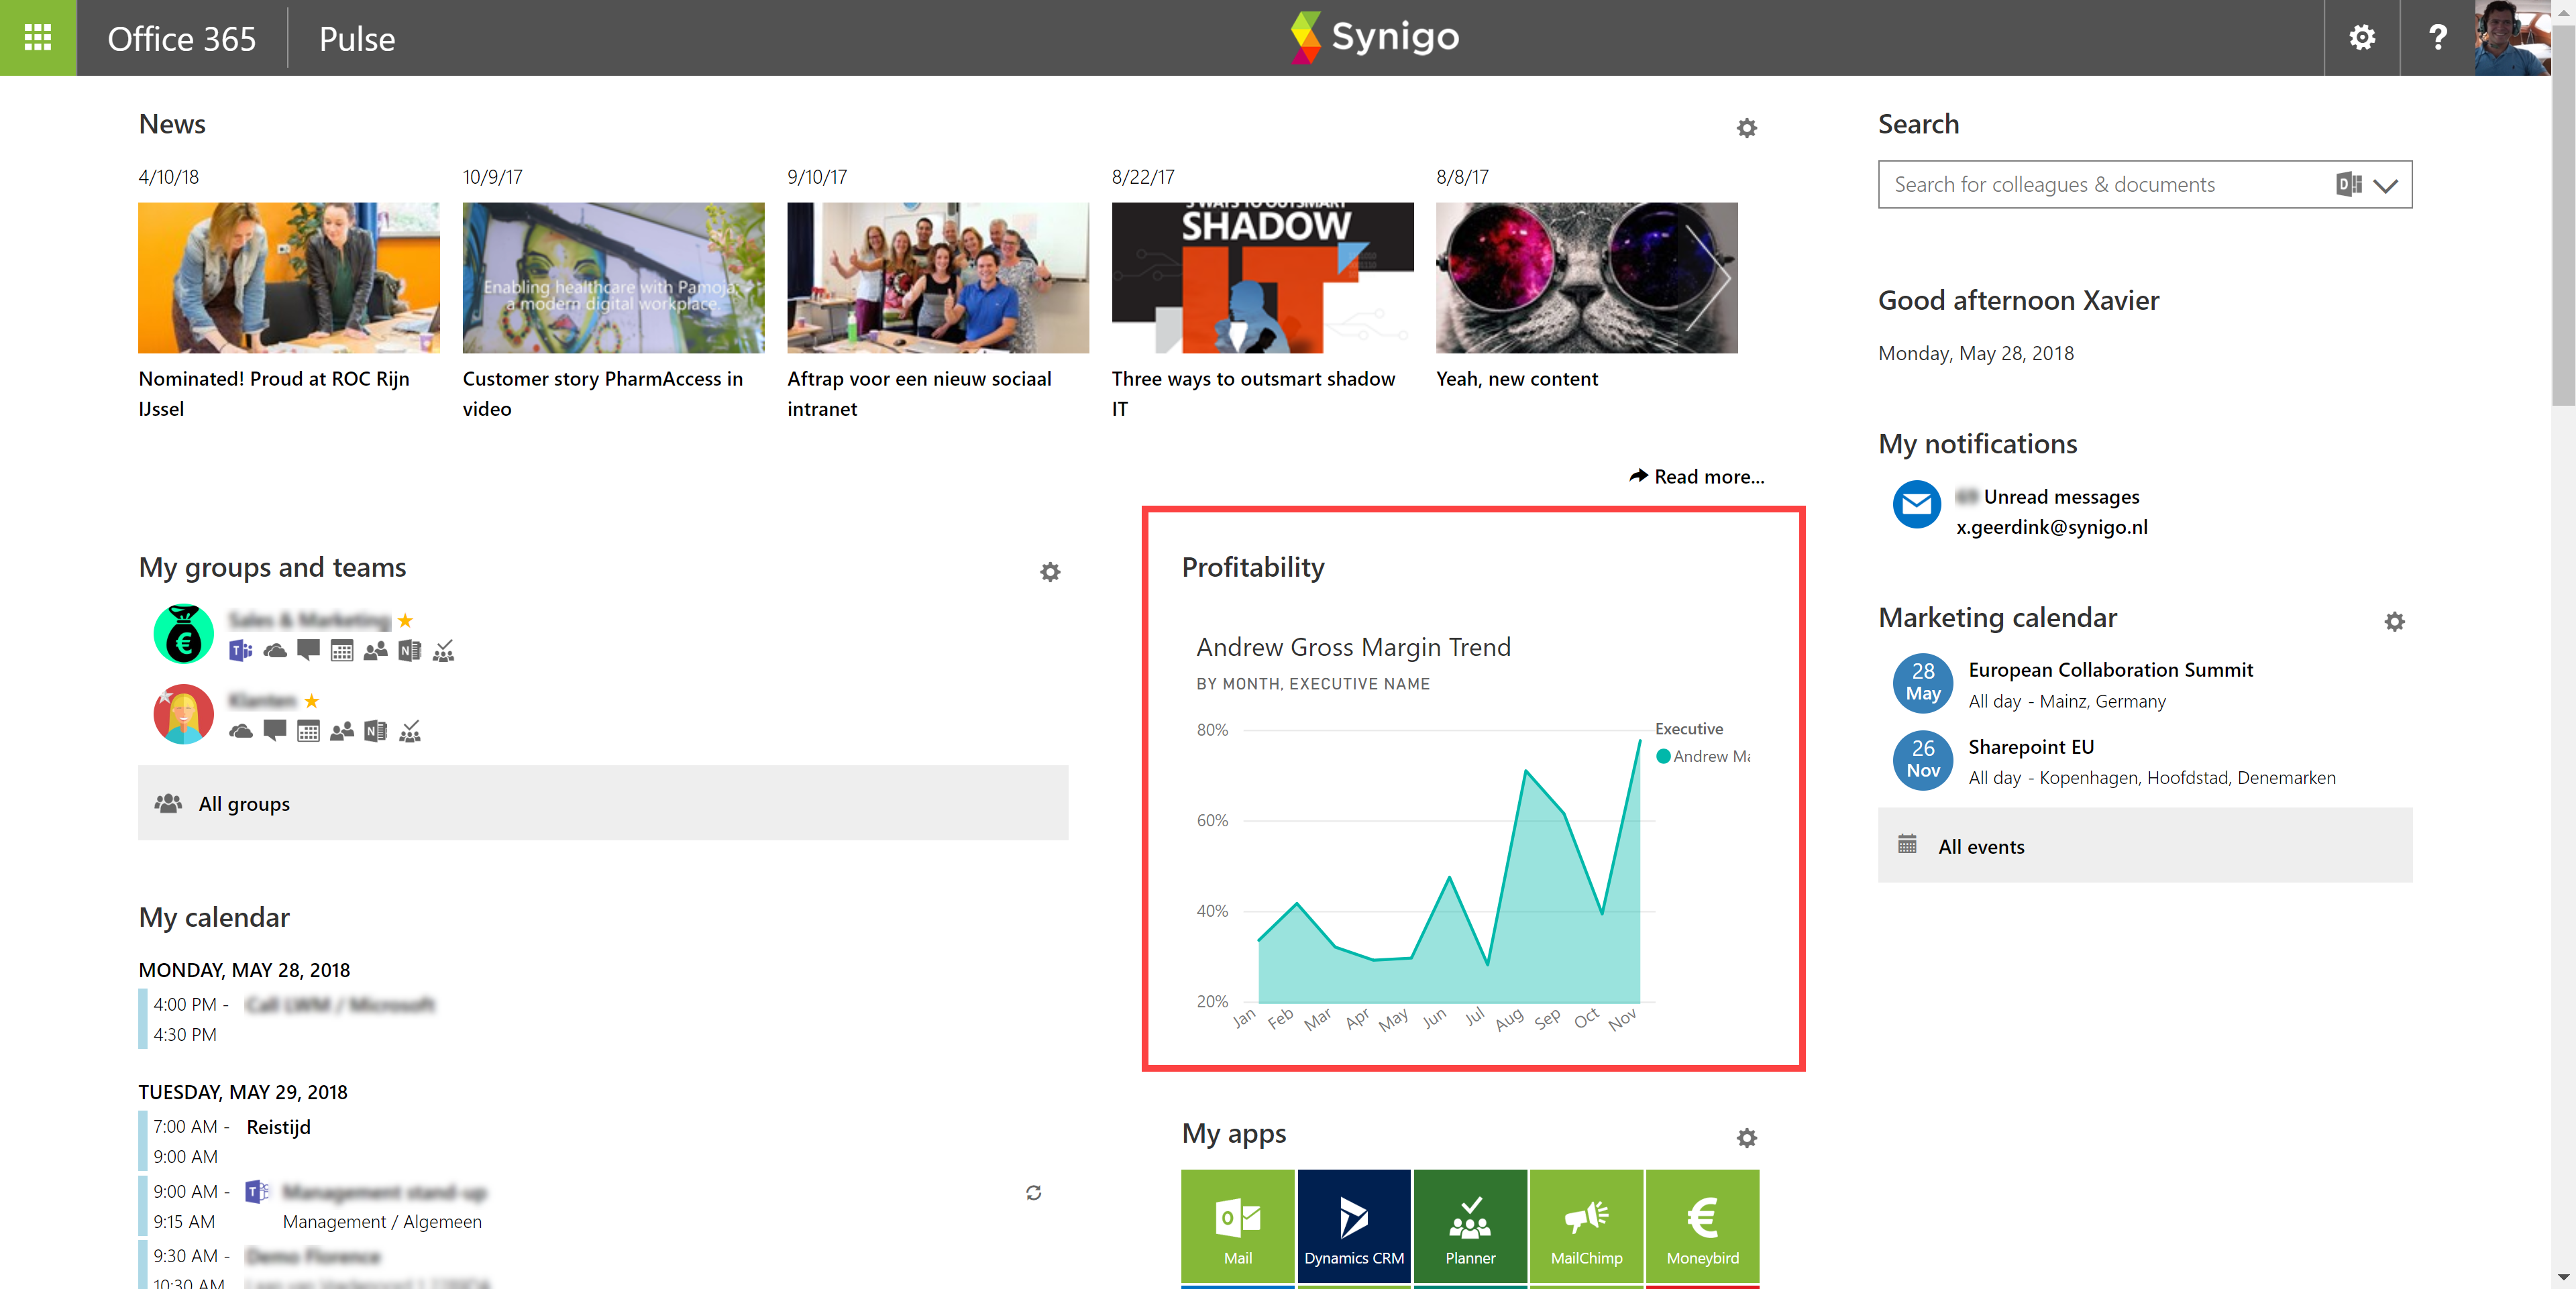
Personal KPI of Financial Profitability on Digital Workplace for Office 365 with PowerBi integration
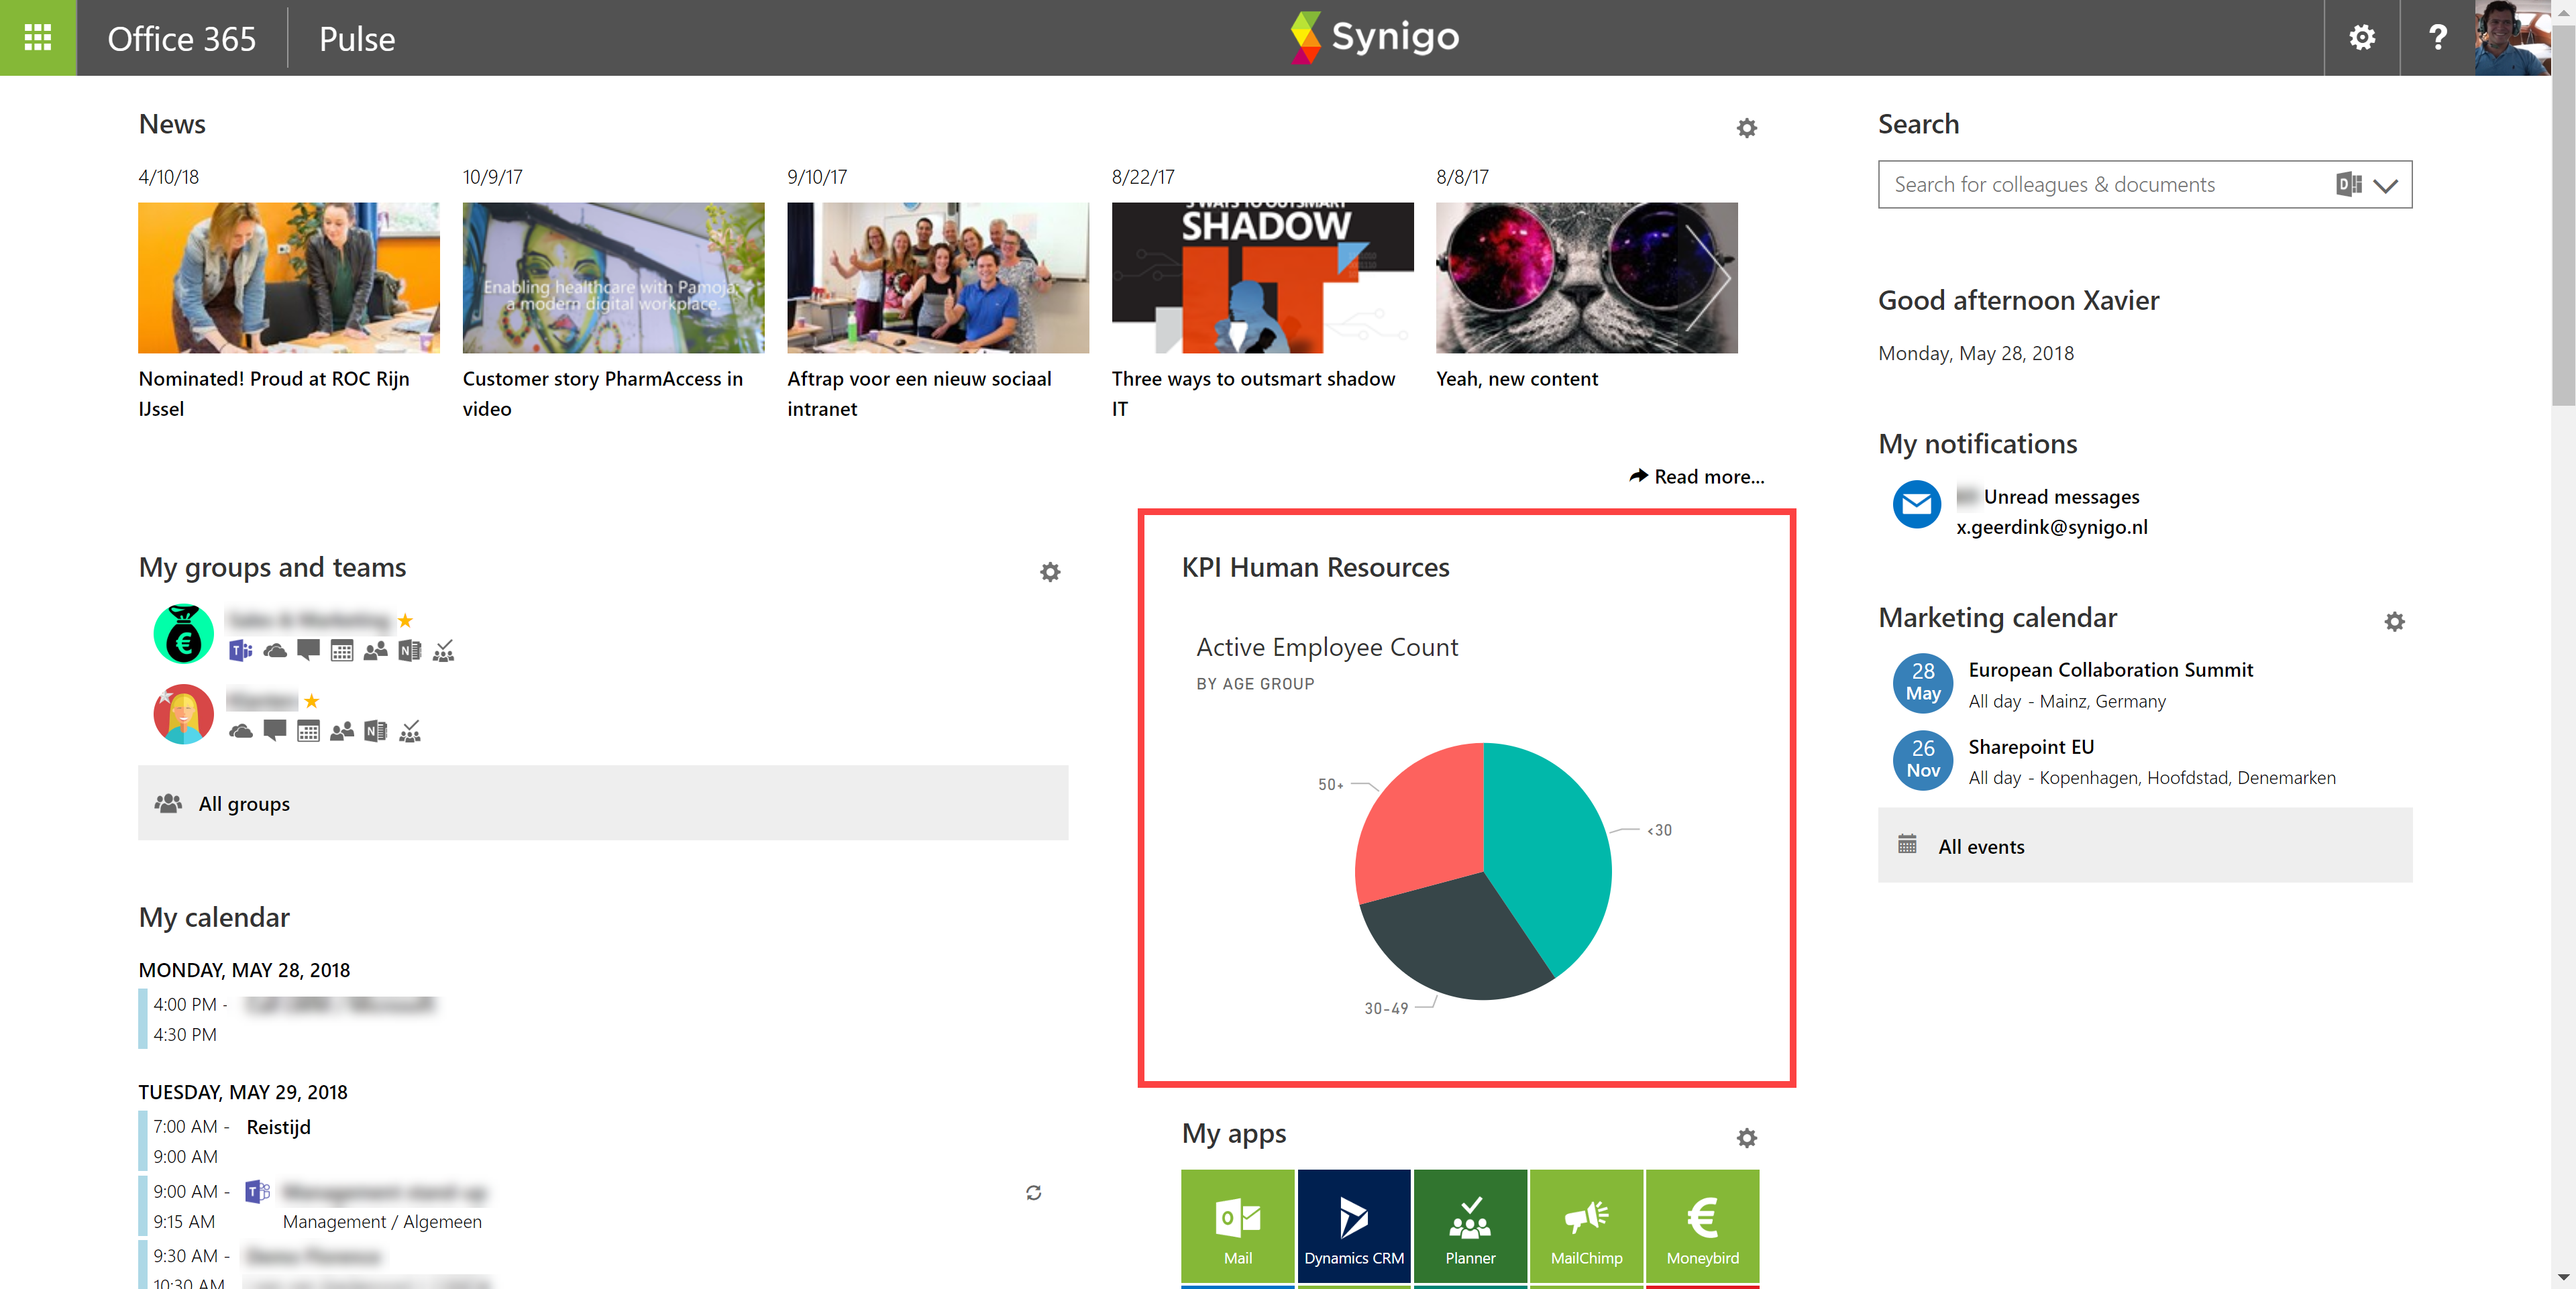
KPI of HRM Employee Count on Digital Workplace for Office 365 with Power BI integration
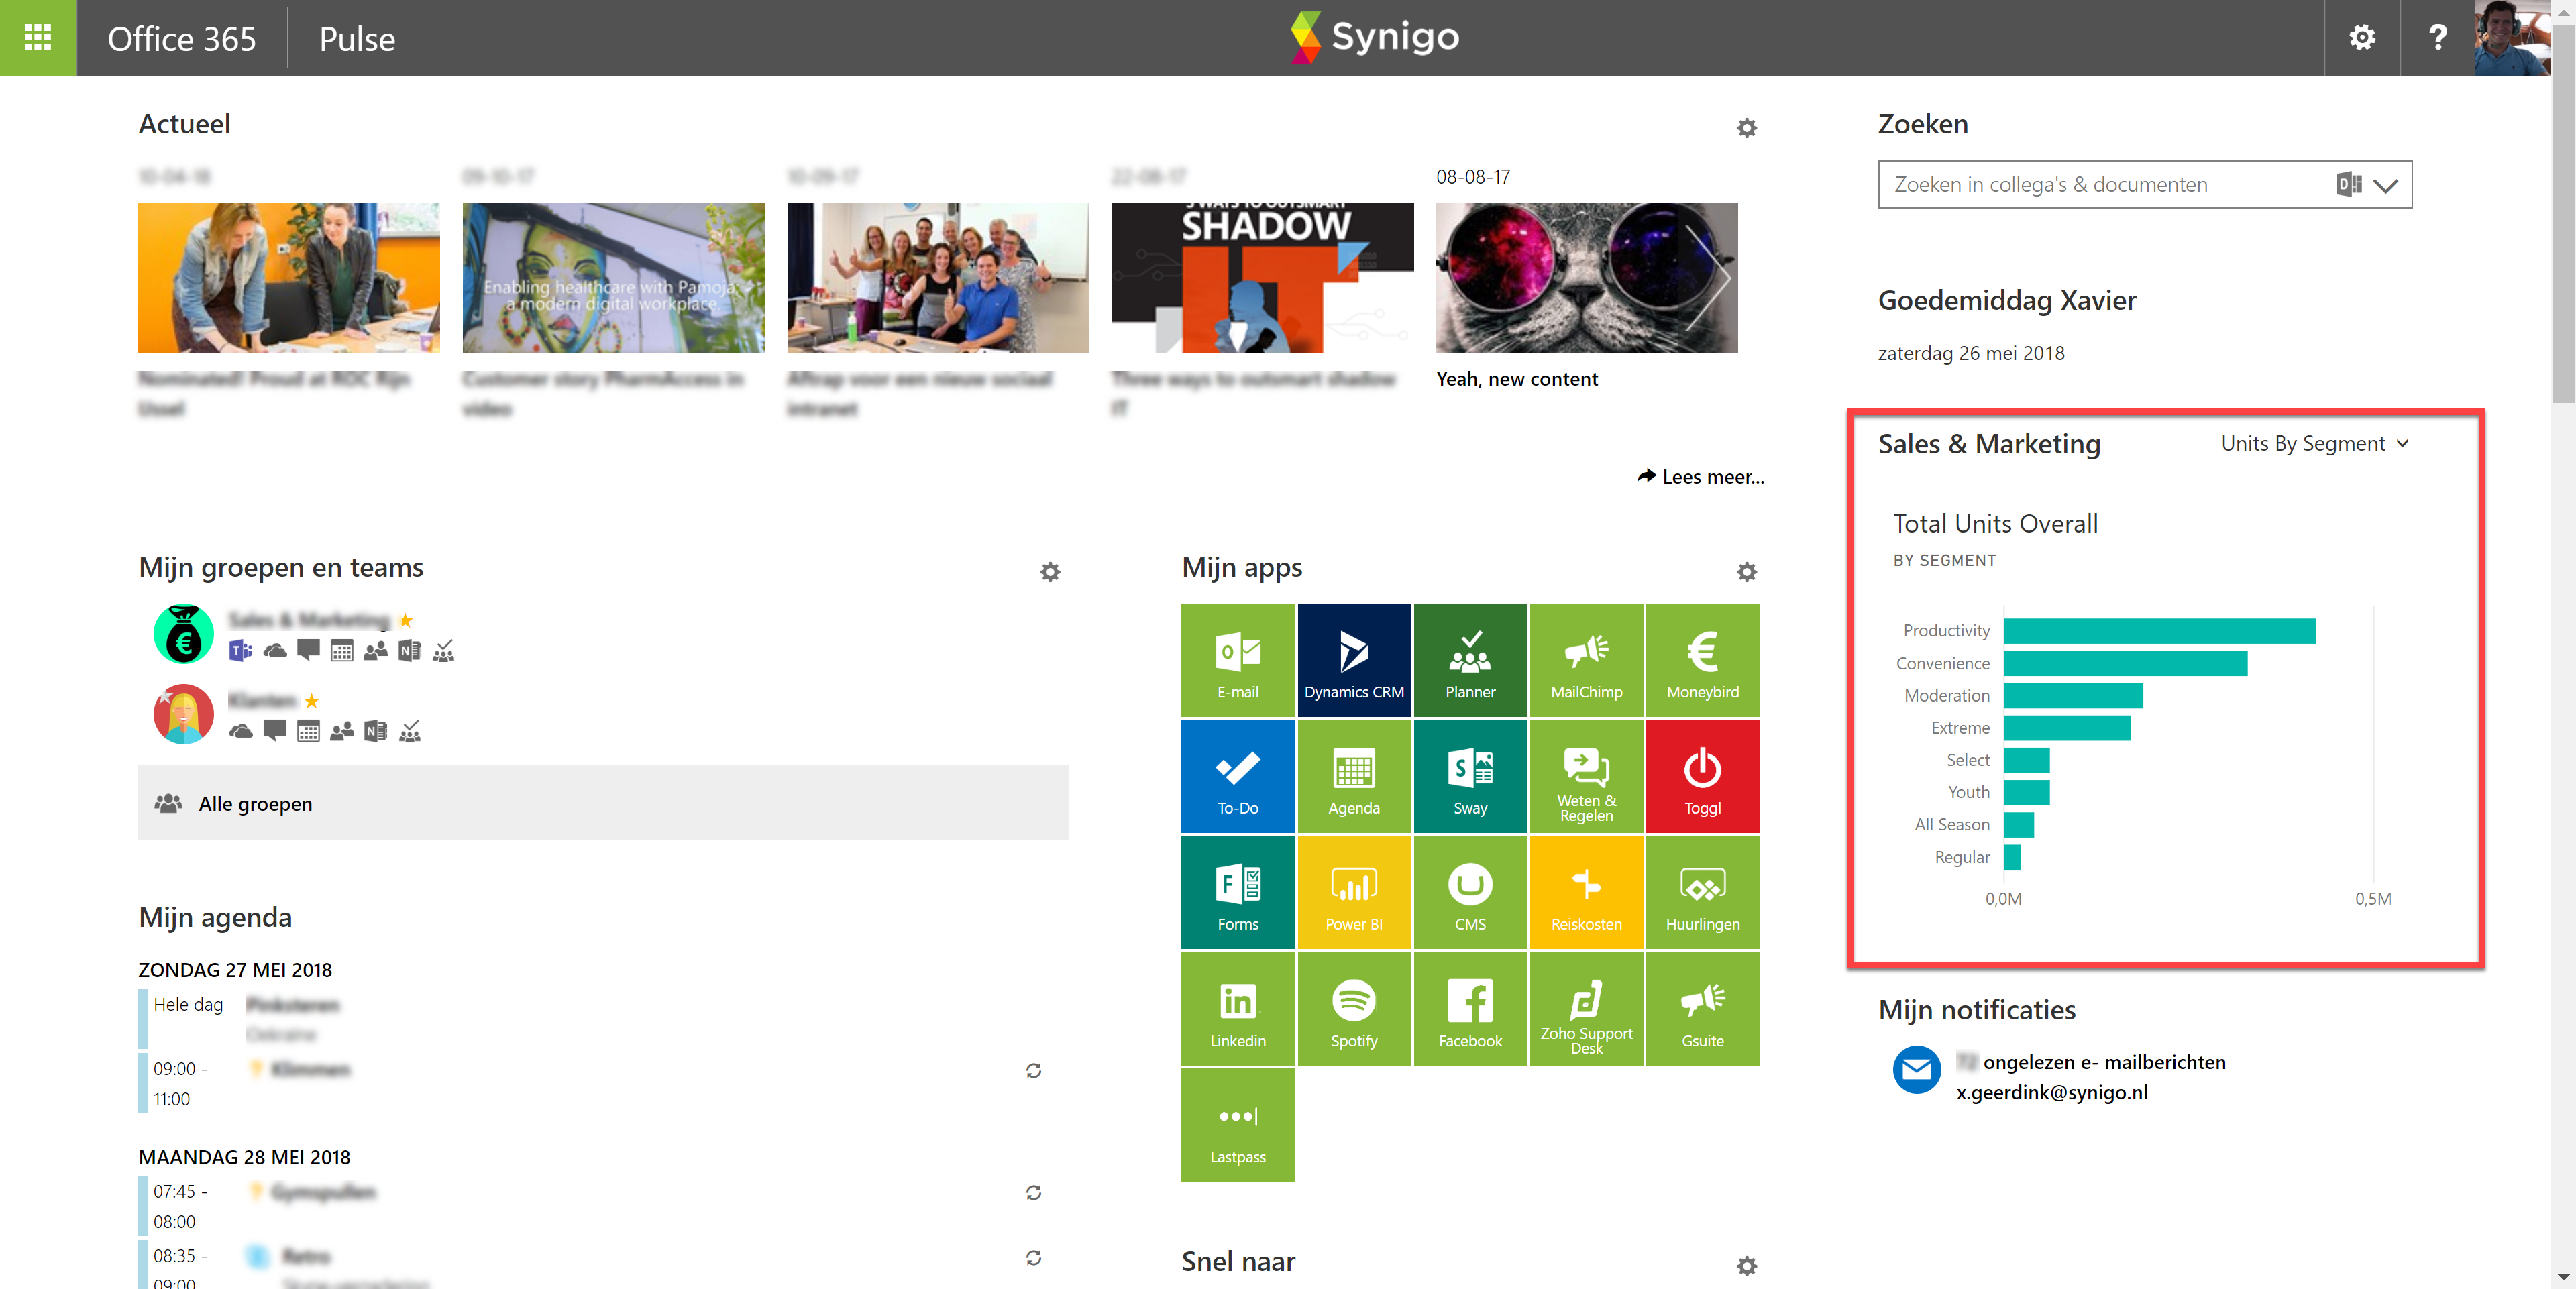
KPI of units sold per business line on Digital Workplace for Office 365
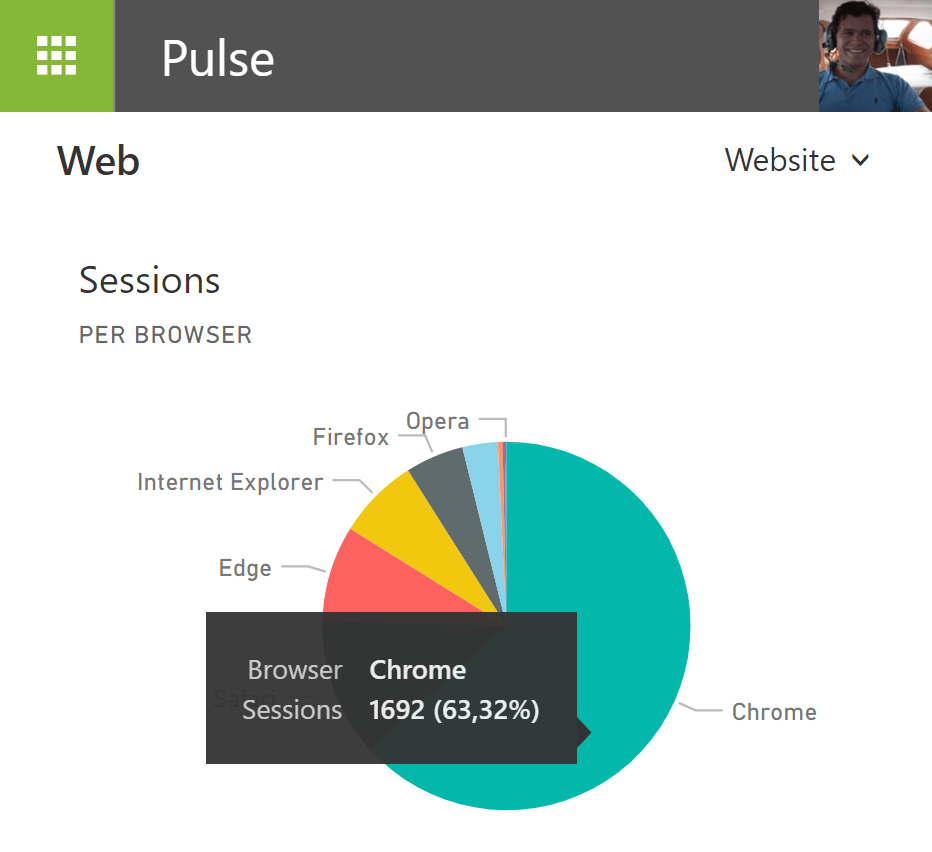
Google Analytics data on Synigo Pulse Digital Workplace using Power BI integration
Step 1. Good KPI
The first step in your Power BI journey for the Digital Workplace is to think about which KPI is compelling to your users. A KPI can be personal or only relevant to a group, team or department. In Synigo Pulse you can define audiences or roles for the Digital Workplace that see unique KPI's. In general a good KPI should be actionable. It must move you to do something (or do nothing).
Step 2. Make up your PowerBI data
You need to have data in Power BI. With Microsoft Power BI you can make fantastic live tiles, dashboards (overview), reports (details) and datasets (the raw data). You always start with the dataset. For example, below you see the HRM dashboard that pulls data together about the hiring process of the organization. Microsoft PowerBI lets you integrate many kind of datasets. Please learn more about Power BI here or consult an expert.
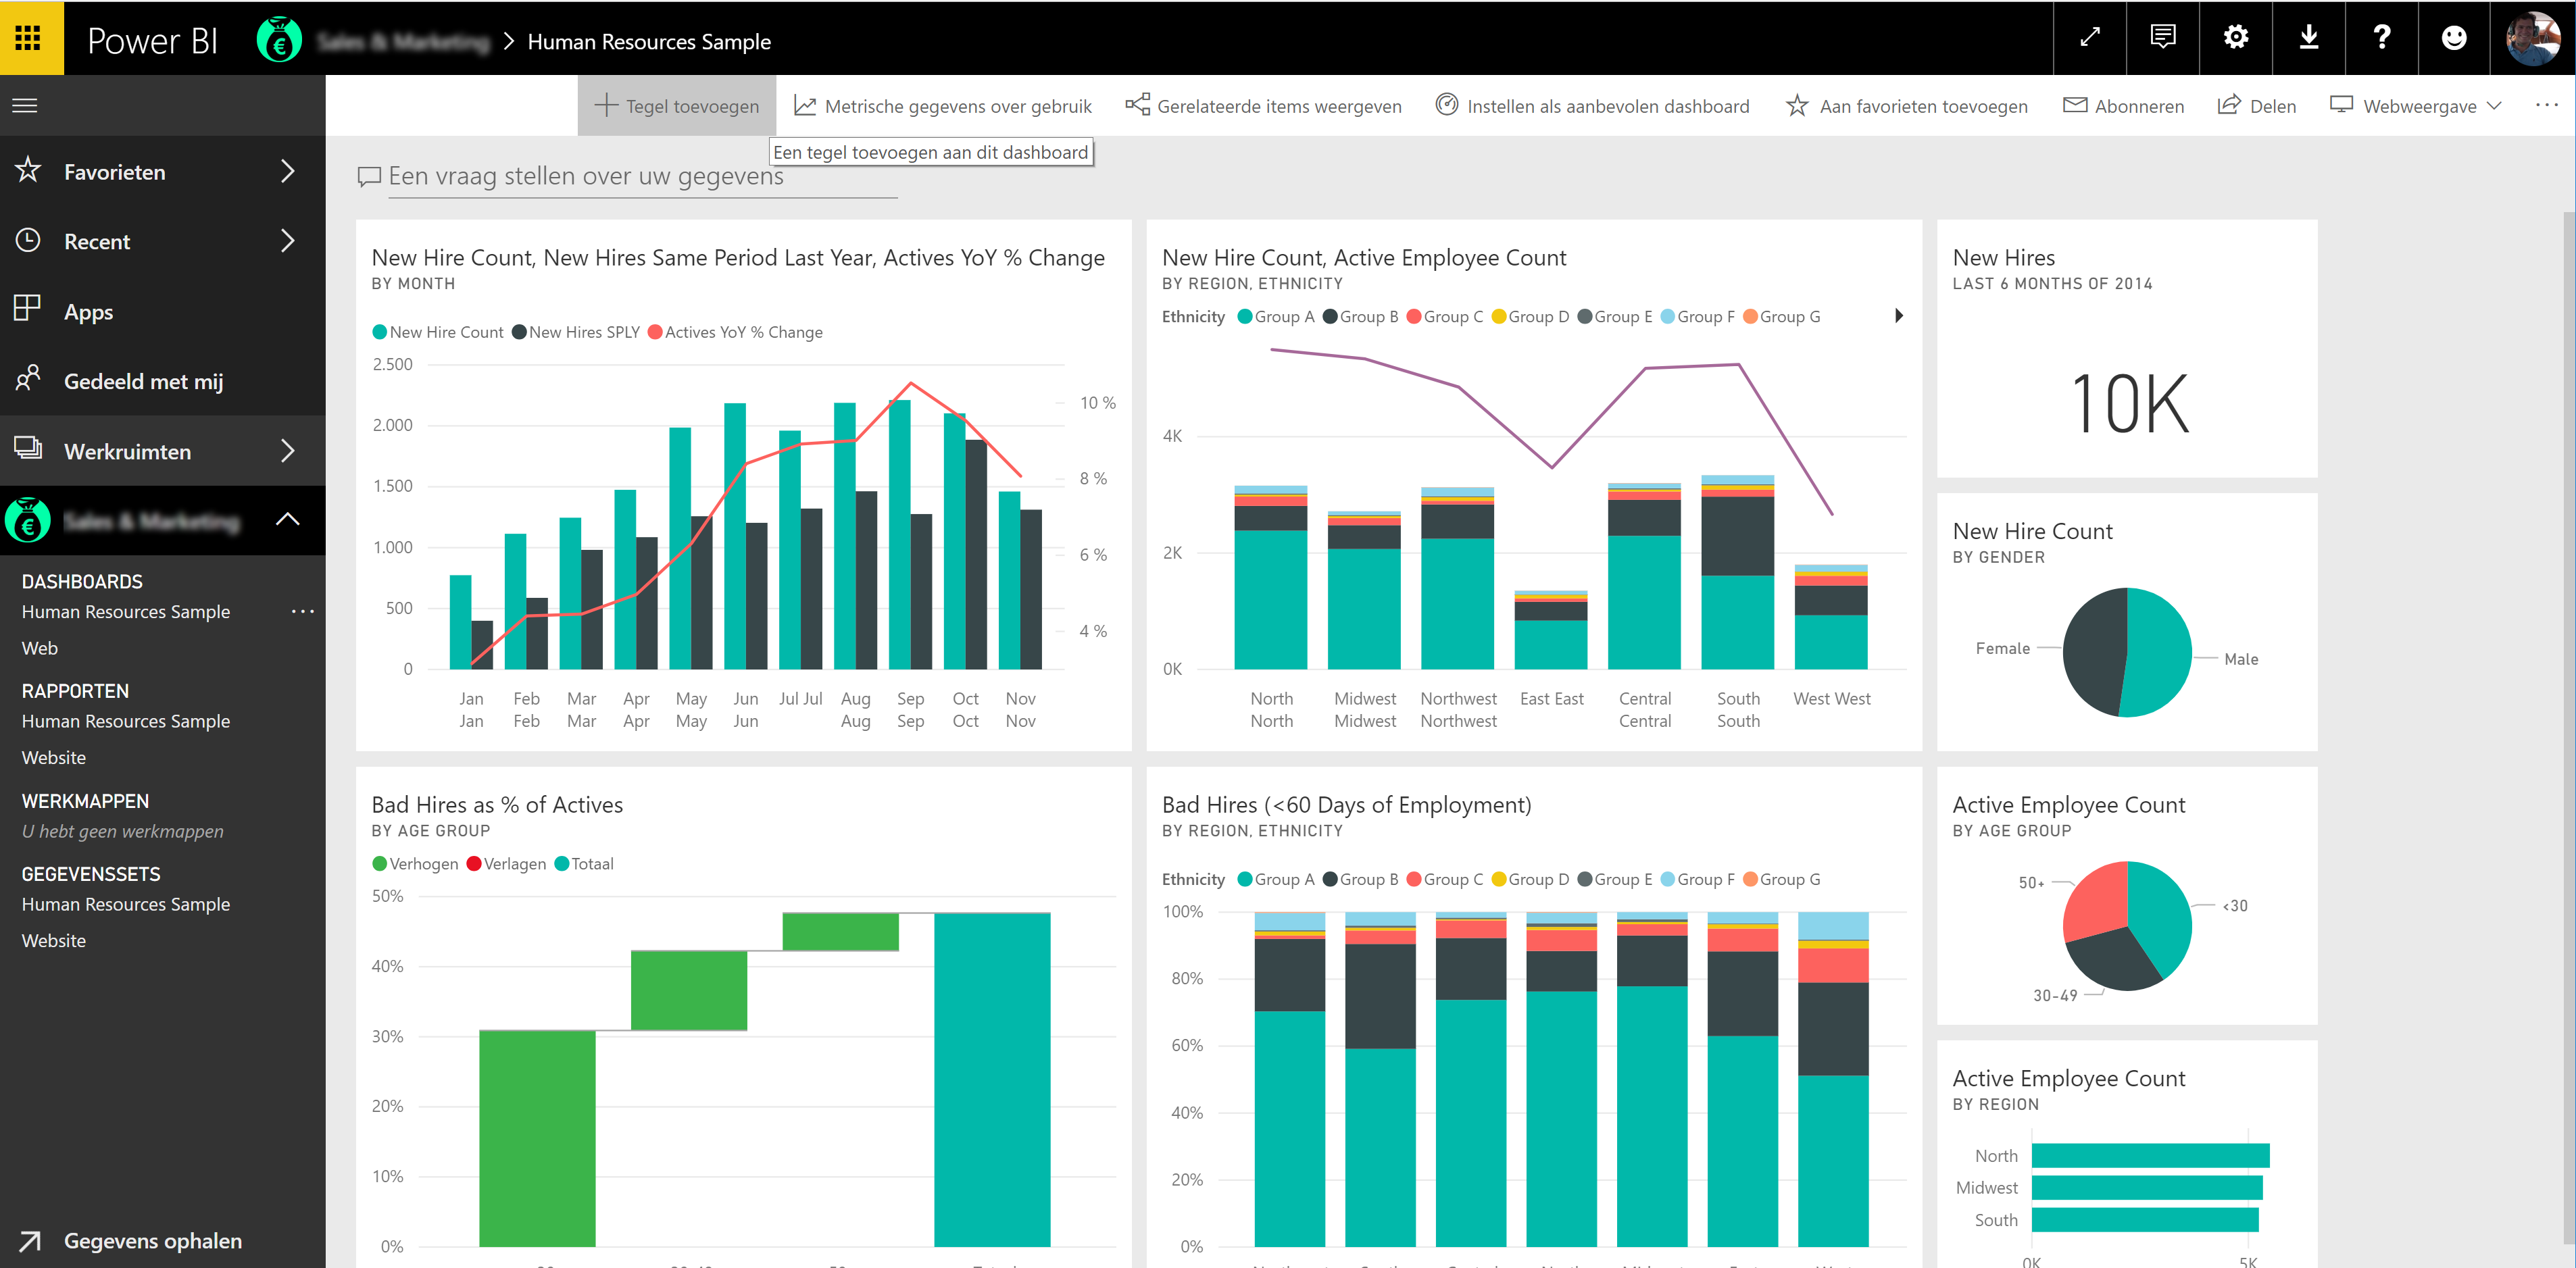
HRM Dashboard in Power BI
Step 3 Add the Power BI widget
In Synigo Pulse you add the Power BI widget to your portal. Go to the list of widgets and press on the three dots. You see the list of available widgets. Select Power BI widget and add it your environment.
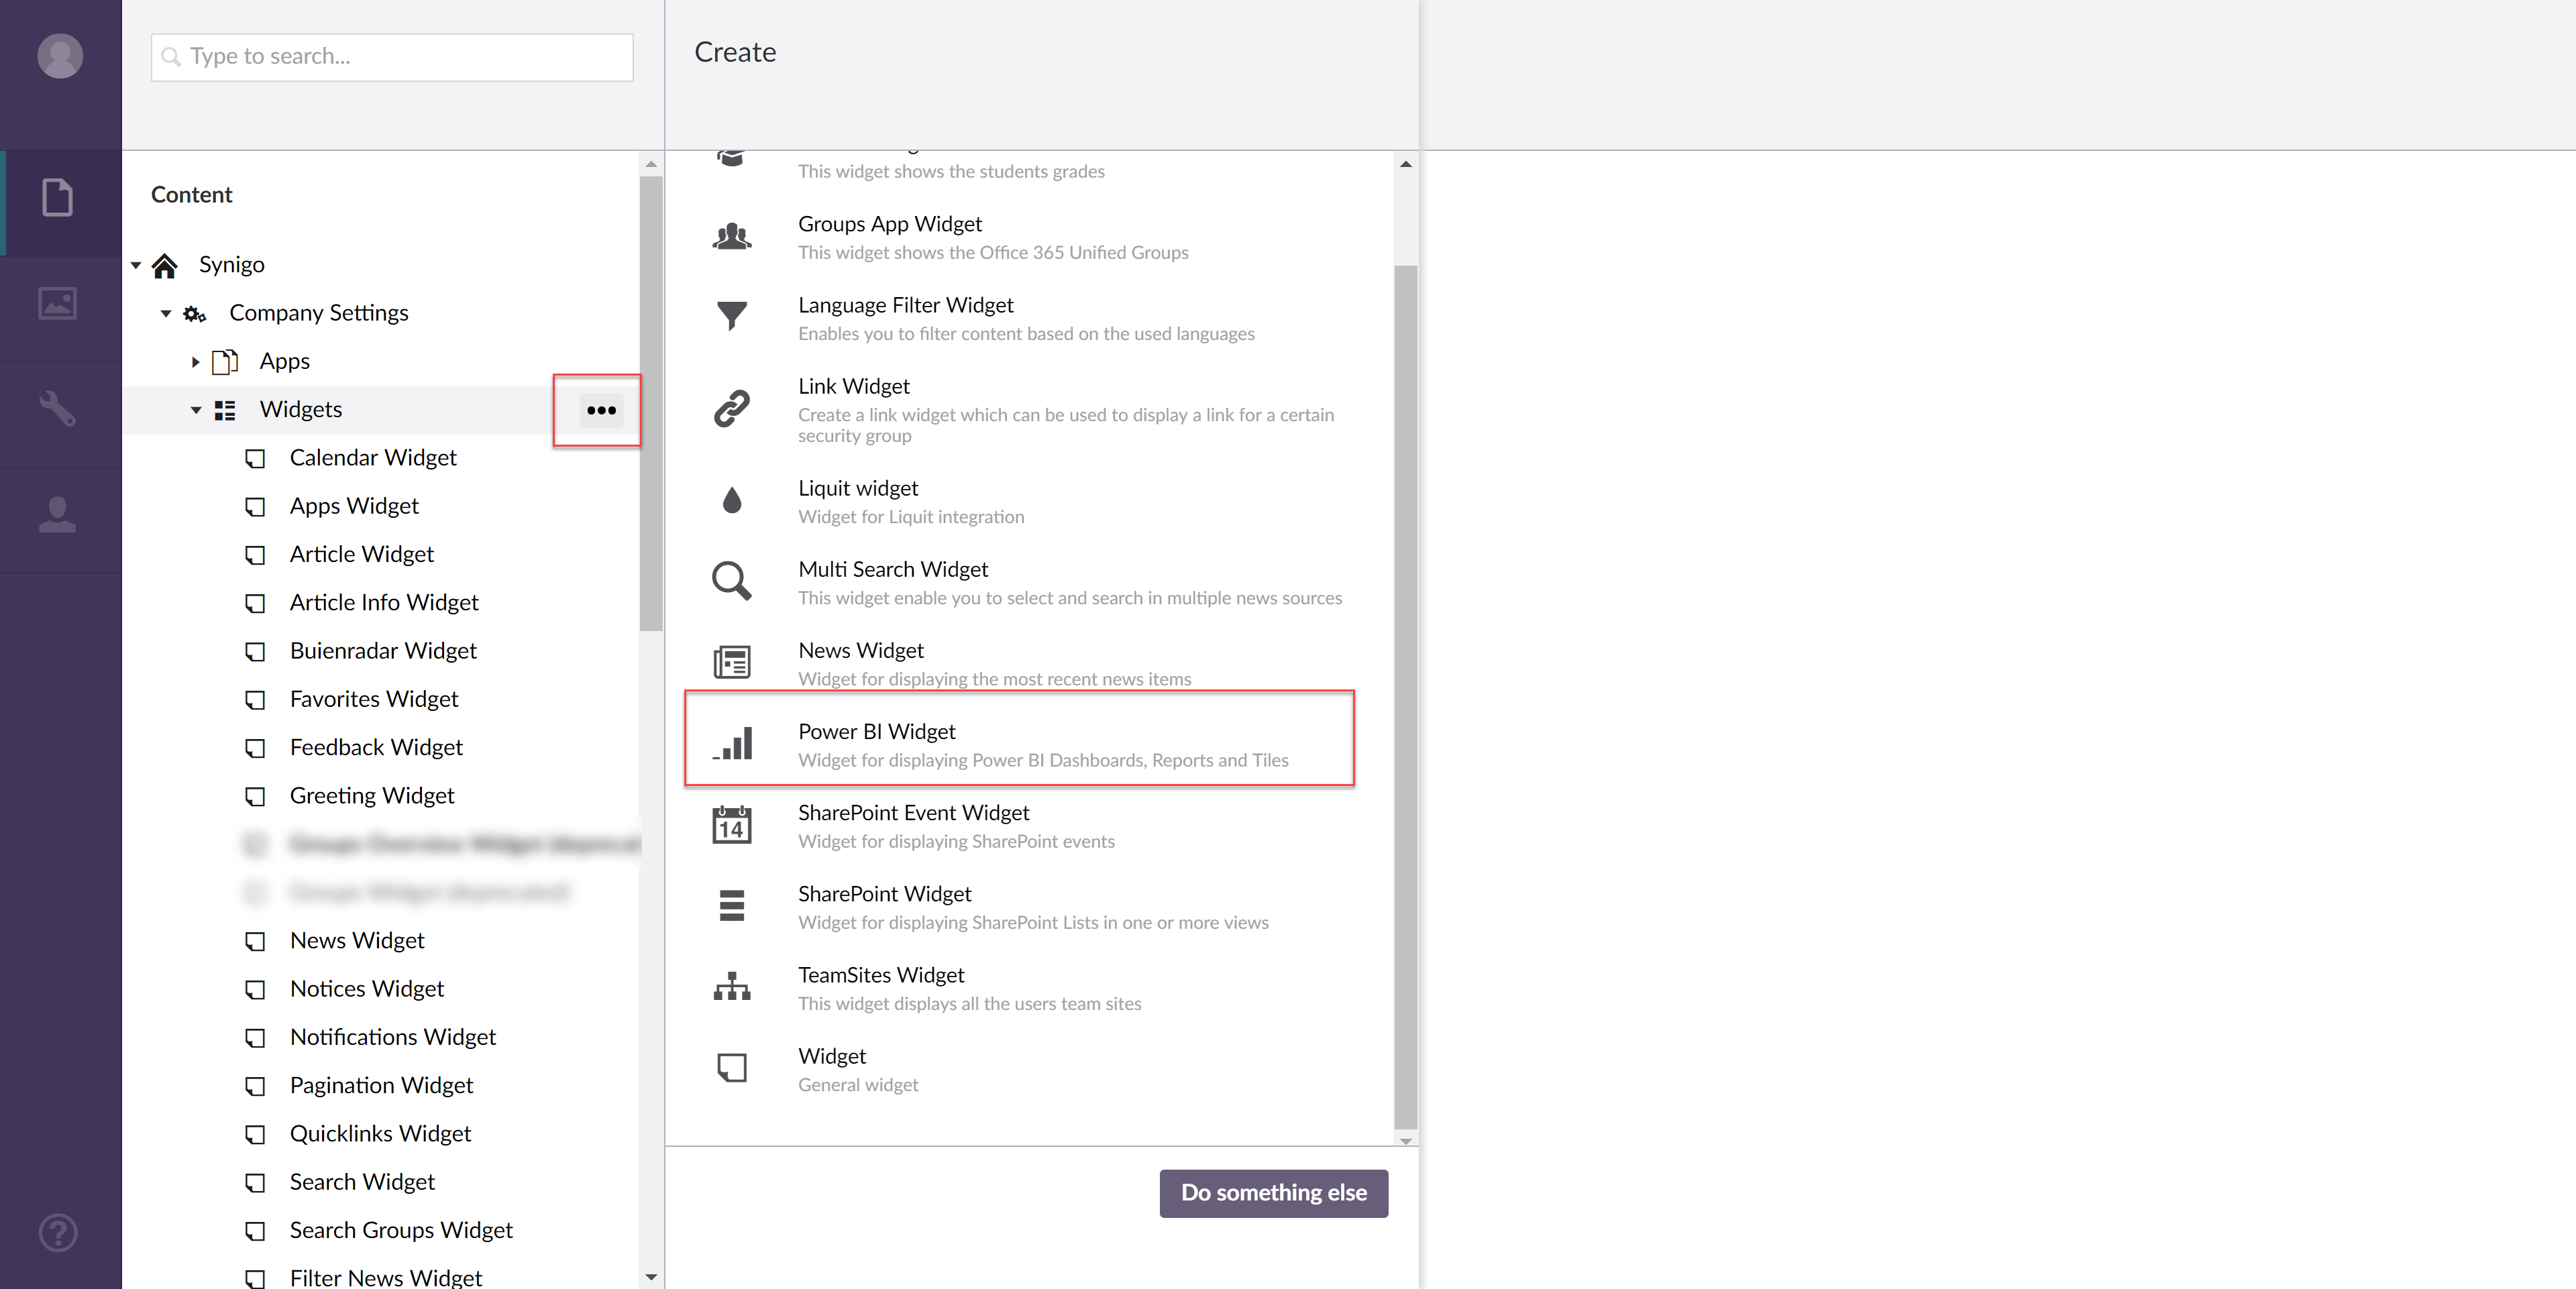
Add PowerBI widget to your Synigo Pulse environment
Step 4 Configure Power BI widget
Following the tabs from left to right you fill in the following information:
Settings
Here you fill in information how the widget is displayed on your Digital Workplace.
Example of settings PowerBI widget Synigo Pulse
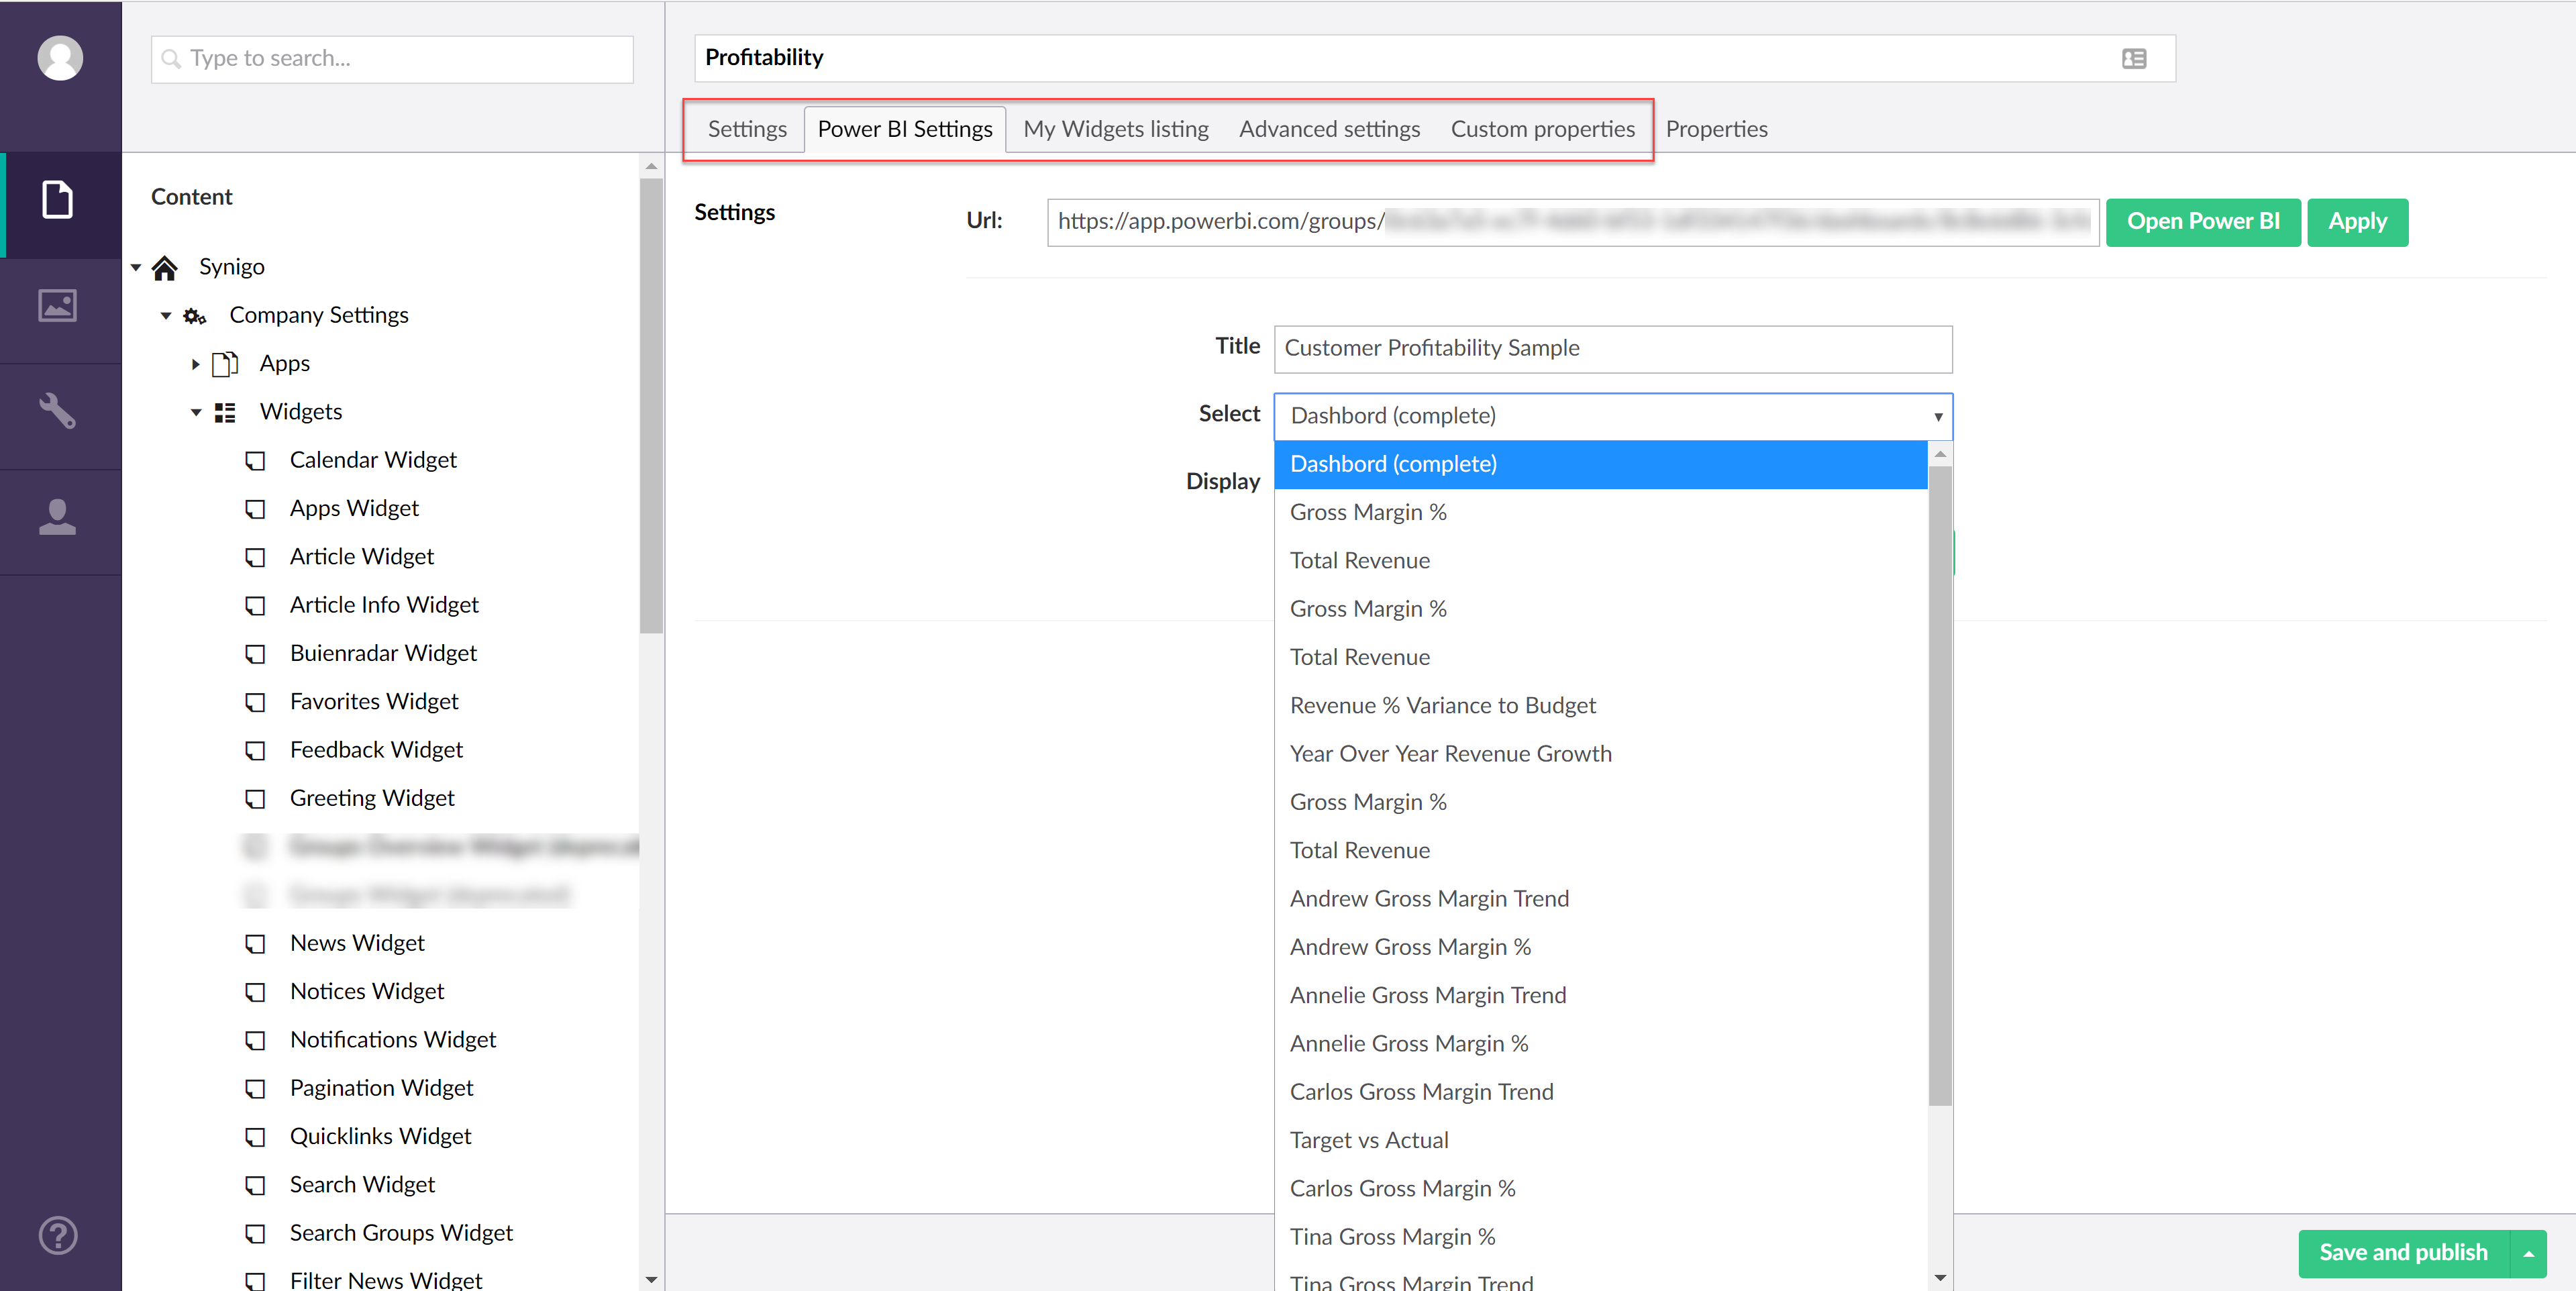
Power BI Settings
Go to Microsoft Power BI and open your Power BI dashboard (or report). Make sure the Power BI dashboard/report/dataset is shared with the proper users. In Power BI you control this using the Workspaces (Office 365 groups). Copy/paste the URL of the Power BI dashboard and paste it in the field URL and press Apply.
Write a title that clearly describes the view of this tile/graphic. This title is shown in the toggle menu on the Digital Workplace. If needed users can toggle between different views of the Power BI dashboard/report.
Choose the desired resolution of the widget: (4:3) square or (16:9) rectangular. I choose square by default.
My Widgets listing
These fields help users to find the widget in the widget pane. This only applies in case the widget is optional.
Advanced settings
Widget key
Fill in: sn-power-bi
Personalization key
Fill in: powerBI
Source
Fill in: /api/powerbi/accesstoken
Sync
leave unchecked
Custom Properties
You don't have to add anything here.
Press save and publish
Step 5 Test and share
Always test the effectivity of the KPI on your Digital Workplace. You could do this using in a test audience and assign a portal definition to this AD group.
Enjoy, and get in touch in case you have any questions.
